This article presents only general professional opinions and does not constitute legal, regulatory, financial, or compliance advice relating to your particular case. Reading it creates no consulting relationship with GRAYS™ Strategy. Figures come from the sources cited, as of the publication date, so please check them before you rely on them.
A rate cut doesn’t necessarily land level. Two revenue lines can be subject to the same percentage cut and end up very different in terms of their shape. A lot of that difference is down to the numbers you already have from last year.
The Centers for Medicare & Medicaid Services (CMS) published two payment rules in July 2026 (one final and one proposed) (CMS, 2026a, 2026b).
CMS has finalized a 2.3% increase in hospital inpatient payment rates for FY 2027. That’s for hospitals which meet the quality reporting and EHR requirements. You start with the projected 3.2% increase in the hospital market basket (the market basket is a statistical measure of the price changes of the goods and services that hospitals use to treat their Medicare patients), take off the 0.9 point productivity adjustment, and you end up with 2.3% (CMS, 2026b).
CMS’s CY 2027 proposal would reduce the conversion factor from $33.40 to $32.84 for practitioners who aren’t qualifying participants in alternative payment models. That’s a 1.68% reduction as of October 2026 (CMS, 2026a).
Qualifying participants have a separate proposed factor (CMS, 2026a).
Start with the rate behind each line
Start by listing all your revenue streams and alongside each line put the rate that generates it (the Medicare inpatient update rate, the fee schedule conversion factor, an identified agreement or schedule for the rest). Then categorize each line as public, negotiated, or a combination. If there are any combinations, then work out what percentage of that line’s revenue is derived from the public rate. The public lines will generally be the ones that leave you most exposed to this type of cut.
Measure how thin the margin is
A 1% cut takes 1% of the revenue from each line it touches. A thin margin has less to play with.
Divide the rate change by the line’s margin to work out what proportion of the profit the cut takes away (assuming costs are static). For a line that has both components the test only applies to its public share of the revenue. Take a hypothetical line with a 4% margin on $100 of revenue. A 1.68% cut (the proposed change for practitioners who aren’t qualifying participants, CMS, 2026a) would take away $1.68 of the $4 profit. That’s 42%. The same cut on a line with a 12% margin would take away 14%.
Even an increase can cost you. Run the 4% line through the hospital update. Revenue is up 2.3% under the update and costs are up 3.2% (the projected market basket rate, CMS, 2026b). Profit would go from $4 to about $3.23 (a drop of roughly 19%). These are made-up numbers, but the rates are real.
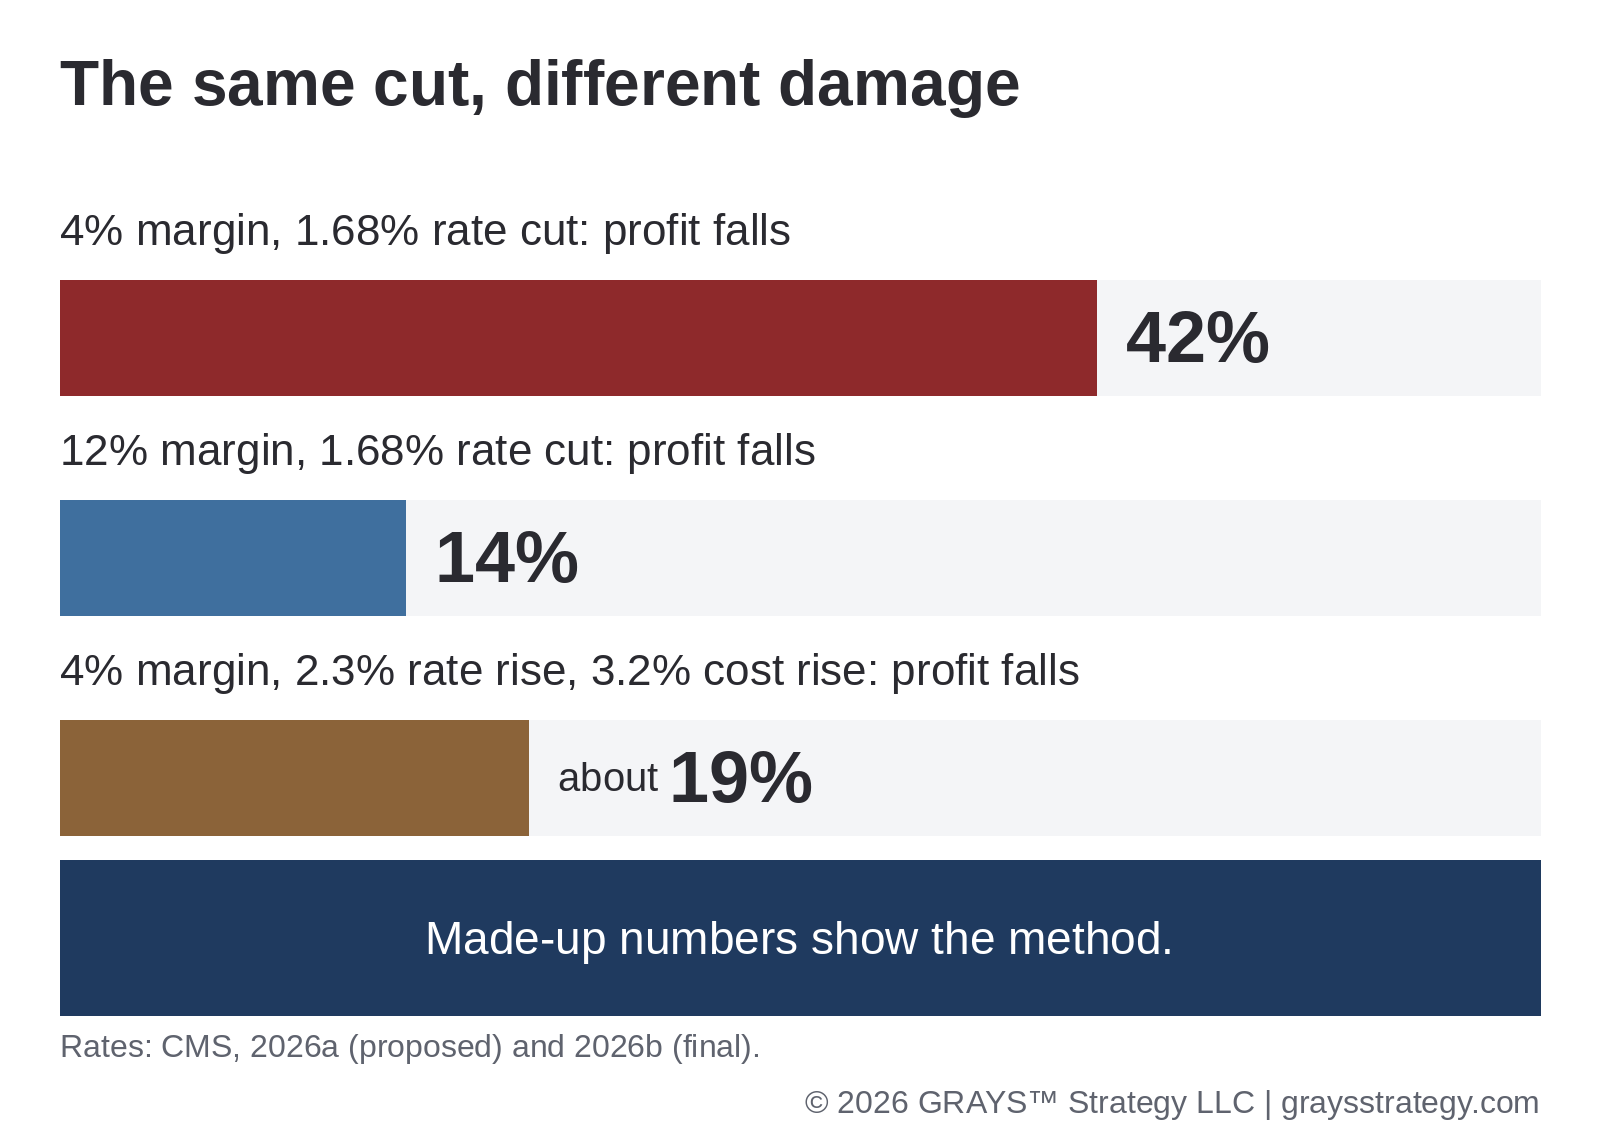
Figure 1. Made-up example: a proposed 1.68% rate cut removes 42% of profit at a 4% margin and 14% at a 12% margin. Sources: CMS (2026a); CMS (2026b).

Sort every cost by speed
Tag each cost as fast, slow or fixed depending on whether you can move it in the next 90 days. If the only way to move a cost is to renegotiate the contract then it’s a slow cost. A line with a thin margin and a high proportion of slow and fixed costs has very little headroom for a cut.
Watch for volume, too
A cut could be made on the volume basis rather than the rate basis. In June 2026 the CMS actuaries projected that Medicaid enrollment would fall from 84.3 million in 2024 to 78.2 million in 2028 (CMS Office of the Actuary, 2026) which would be a drop of around 7% by our calculation. If that national trend were to occur for a line which was 100% funded by Medicaid (prior to any cost changes), that line would see an approximate loss of 7 cents per dollar of revenue over that period.
Rank the lines
Set the lines out in one table: rate source, margin and cost speed. Put the line with a public rate, a thin margin and slow costs on top. That line gets the plan first (that could be a price conversation, a cost move that you can do in 90 days or a decision to restructure the line).
Cost will be static in this test and you’ll only be making one change at a time. The result is to be treated as an initial ranking of where to look first rather than a forecast for the year. The physician fee schedule numbers are a proposal as of October 2026 (CMS, 2026a), so they could well change, and it would be prudent to run the test again once CMS has issued the final physician fee schedule rule.
Pick one line and complete its row this week.
Questions about how this applies to your organization? Reach out at info@graysstrategy.com.
Share this article on LinkedIn
References
Centers for Medicare & Medicaid Services. (2026a, July 14). Calendar year (CY) 2027 Medicare physician fee schedule proposed rule [Fact sheet]. https://www.cms.gov/newsroom/fact-sheets/calendar-year-cy-2027-medicare-physician-fee-schedule-proposed-rule. Retrieved October 26, 2026.
Centers for Medicare & Medicaid Services. (2026b, July 31). FY 2027 hospital inpatient prospective payment system and long-term care hospital prospective payment system final rule (CMS-1849-F) [Fact sheet]. https://www.cms.gov/newsroom/fact-sheets/fy-2027-hospital-inpatient-prospective-payment-system-long-term-care-hospital-prospective-payment. Retrieved October 26, 2026.
Centers for Medicare & Medicaid Services, Office of the Actuary. (2026, June 24). National health expenditure (NHE) projections: 2025–34 [Presentation]. https://www.cms.gov/files/document/national-health-expenditure-projections-results-presentation.pdf. Retrieved October 26, 2026.
GRAYS™, GRAYS Method™, and Clarity in Complexity™ are trademarks of GRAYS™ Strategy LLC. © 2026 GRAYS™ Strategy LLC. All rights reserved. This content reflects general commentary and professional analysis current as of its publication date. It does not constitute legal, regulatory, financial, or compliance advice, and should not be relied upon as a substitute for professional counsel specific to your organization’s circumstances. Regulatory developments referenced herein may change after publication; readers should verify current status independently before acting.
More from Clarity Defined