This article presents only general professional opinions and does not constitute legal, regulatory, financial, or compliance advice relating to your particular case. Reading it creates no consulting relationship with GRAYS™ Strategy. Figures come from the sources cited, as of the publication date, so please check them before you rely on them.
A turnover rate doesn’t tell you what a departure costs. Two clinical roles can lose the same share of their staff in a year and leave you in very different places. Much of that difference can come down to how long each role takes to replace.
NSI Nursing Solutions, a nurse recruitment firm, surveyed 527 hospitals about 2025. Hospital turnover averaged 18.5%, and staff registered nurse (RN) turnover averaged 17.6% (NSI Nursing Solutions, 2026). Role averages ran from 9.8% for nurse practitioners to 33.8% for patient care technicians (NSI Nursing Solutions, 2026). Physical therapists averaged 11.1% and certified nursing assistants 32.5% (NSI Nursing Solutions, 2026). The survey covers hospitals only, so read its numbers as a reference point for your own.
Start with the rate for each role
List every clinical role you employ. Next to each one, put last year’s turnover: separations divided by average headcount. Then compare each role with the survey figure. The comparison shows where you sit against hospitals, not which role costs you most. The next three steps do that.
Measure how long each role takes to replace
Replacement time has two parts: the days to fill the position and the weeks until the employee works at full capacity. In a 2022 review, five of nine nurse turnover cost studies found vacancy or temporary replacement to be the largest cost. Three others found the new hire’s lost productivity to be the largest (Bae, 2022). NSI reported an average of 78 days to recruit an experienced RN. Telemetry nurses took 87 days and emergency nurses took 70 (NSI Nursing Solutions, 2026). These are figures specific to hospitals. Use your own data for the days to fill each position and the weeks until employees work at full capacity.
Price one vacant day
Assign an actual cost for each day a position is vacant. Calculate the cost of covering the loss (agency, overtime or travel staff). Then add the revenue or capacity you lose when no one fills the vacancy. NSI estimated that one staff RN departure costs a hospital $60,090 on average. Fewer than half of the hospitals surveyed (46.1%) track the costs associated with turnover (NSI Nursing Solutions, 2026). Bae (2022) reported U.S. hospital costs per nurse departure of $21,514 to $88,000 in studies published from 2004 to 2008. NSI’s cost of $60,090 falls within that range.
Rank the roles
For each role, multiply staff by the turnover rate to get expected departures. Multiply that by the days to replace, then by the cost of a vacant day. The result is the role’s cost for the year.
Here’s an example with two made-up roles. Role A loses 5 out of 20 staff (25%). Each vacancy lasts 90 days and costs $300 a day: 5 × 90 × $300 = $135,000. Role B loses 1 out of 10 staff (10%). Its vacancy lasts 180 days and costs $900 a day: 1 × 180 × $900 = $162,000. Even though Role B loses fewer people, it costs 20% more. These numbers are just examples, but you can use the same method with your own data.
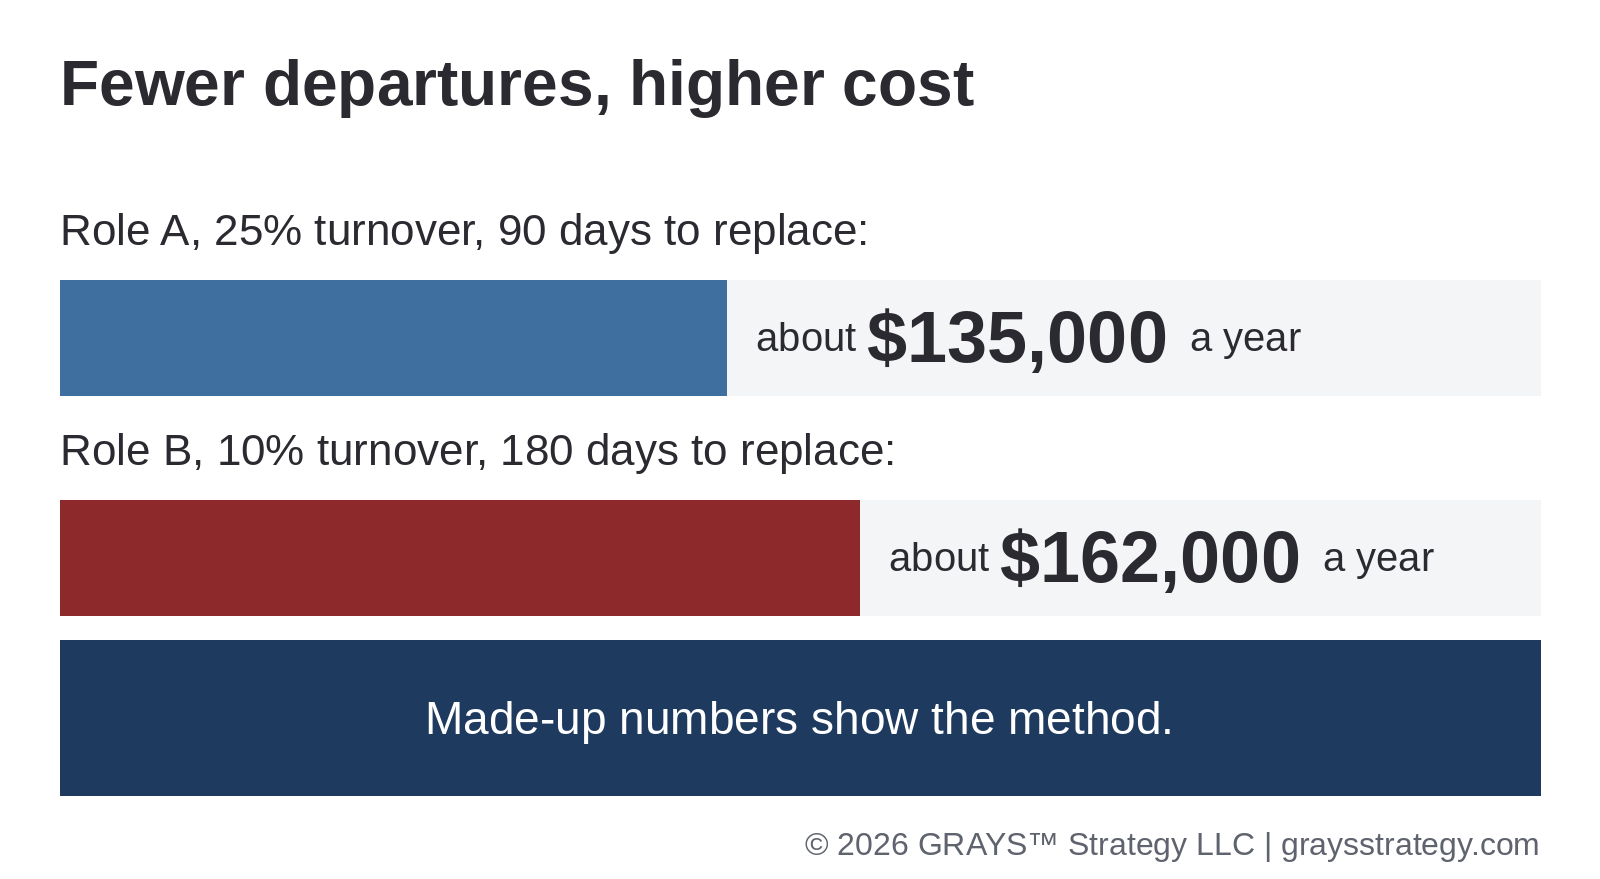
Figure 1. Made-up example: the role that loses fewer people costs about 20% more a year. Made-up numbers show the method.

Check who leaves
Split each role’s departures by years of service. Across all hospital employees in the NSI survey, 29.5% of new hires left within a year (NSI Nursing Solutions, 2026). Of the people who left, 56.8% had under two years of service (NSI Nursing Solutions, 2026). A role whose departures cluster in the first year points to a different conversation than one where long-serving staff leave.
Start with one role
This method keeps each input the same for a year and ranks the roles by cost. Use the result as a starting point for where to focus, not as a prediction of your actual spending. List the role with the highest yearly cost first.
Pick one role and complete its row this week.
Questions about how this applies to your organization? Reach out at info@graysstrategy.com.
Share this article on LinkedIn
References
Bae, S.-H. (2022). Noneconomic and economic impacts of nurse turnover in hospitals: A systematic review. International Nursing Review, 69(3), 392–404. https://doi.org/10.1111/inr.12769
NSI Nursing Solutions, Inc. (2026, March). 2026 NSI national health care retention & RN staffing report [Industry report]. https://www.nsinursingsolutions.com/documents/library/nsi_national_health_care_retention_report.pdf. Retrieved October 30, 2026.
GRAYS™, GRAYS Method™, and Clarity in Complexity™ are trademarks of GRAYS™ Strategy LLC. © 2026 GRAYS™ Strategy LLC. All rights reserved. This content reflects general commentary and professional analysis current as of its publication date. It does not constitute legal, regulatory, financial, or compliance advice, and should not be relied upon as a substitute for professional counsel specific to your organization’s circumstances. Regulatory developments referenced herein may change after publication; readers should verify current status independently before acting.
More from Clarity Defined